A level England - Analysis of 2024 DfE national dataset - March 2025
2024 A Level Results in England
What we know about the 2024 outcomes for A level England

Comparison of DfE 2024 to the Alps Customer benchmark 2024
MEPs and MEGs
What happens now with the 2024 DfE national benchmark?

Therefore, the 2019 national dataset would be the most likely choice when monitoring this cohort across their KS5 courses.
Summary of the benchmarks in Connect and Summit
This article presents an overview of the findings from the Alps review of the DfE national dataset from 2024. It provides a comparison with the Alps provider benchmarks for England produced in August 2024.
It concludes with an overview of the recommendations for benchmark selection for analysing your 2024 results for A level, and for monitoring your Year 13 and 12 cohorts across 2024/25 and 2025/26.
What we know about the 2024 outcomes for A level England
The percentage of different grades are broadly in line with those awarded in 2023 at both cohort and student level.
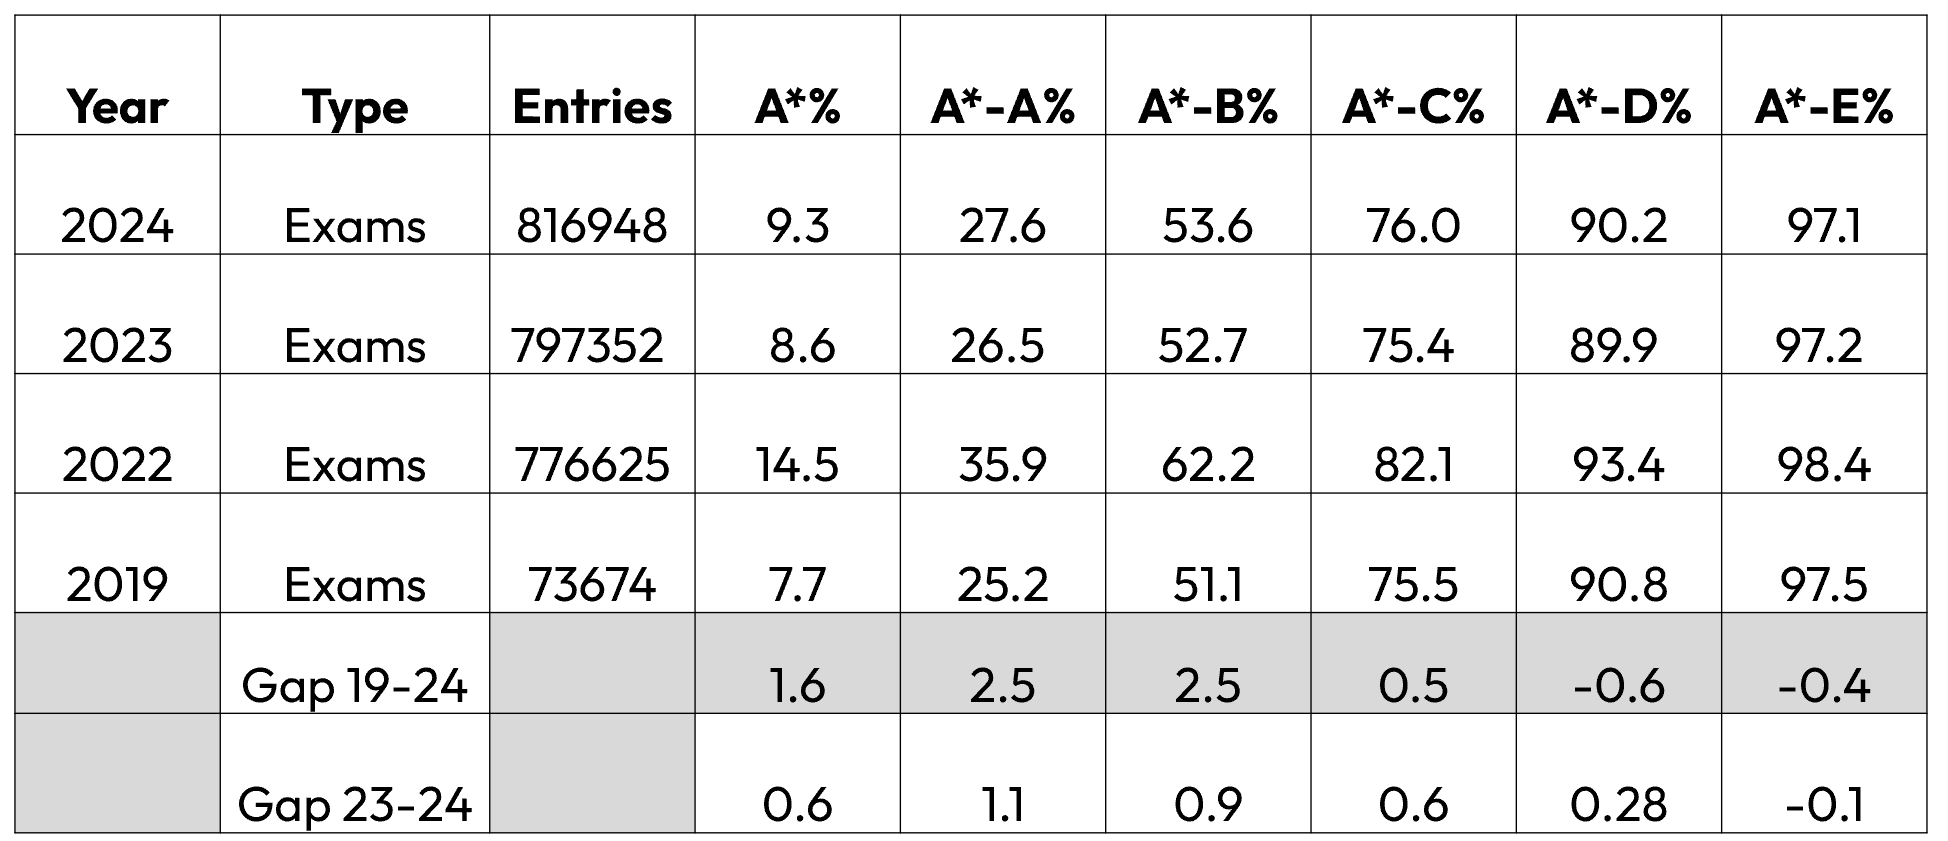
A level Attainment Profile - England
Results for attainment showing gaps between 2019 and 2024, and between 2023 and 2024.
The key points:
Compared with 2019,
- the percentage A* is 1.6% higher
- the percentage A*-A is 2.5% higher
- the percentage A*-B is 2.5% higher
Compared with 2023,
- the percentage A* is 0.6% higher
- the percentage A*-A is 1.1% higher
- the percentage A*-B is 0.9% higher
Prior attainment and cohort context 2019-2025
The 2024 results saw the return of an examined baseline and examined outcome set for Key Stage 5 students. Using the data submitted to Alps since results day, we have carried out a thorough analysis of the dataset and present our findings below.
Prior attainment baseline
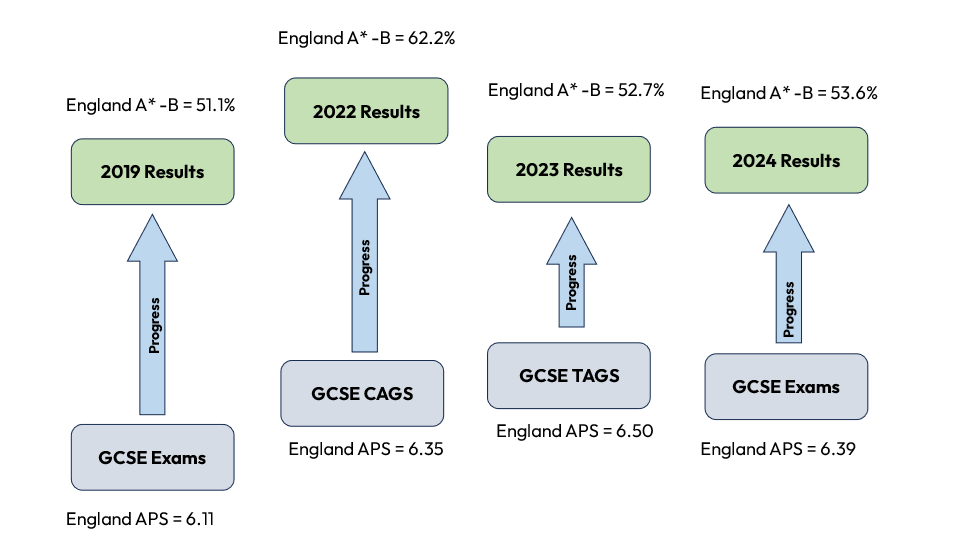
The table above shows that the average prior attainment GCSE score is lower than the TAGs of last year's cohort, but still higher than the 2019 value of 6.11. This means that if we were to represent the value-added profile diagrammatically over the past few years, we would see the following pattern.
The starting point has fluctuated over the past few years, but the outcome end point has also fluctuated. The arrow shows the relative size of the value-added progress journey.
The 2024 value-added arrow shows a more truncated picture than in 2019. The Alps Customer benchmark generated in August 2024 provided a more representative value-added picture than the 2019 DfE national benchmark, and has allowed leaders to develop school improvement priorities in the weeks following the examinations.
In the analysis of the 2024 DfE data, we can now explore how representative the Alps Customer benchmark has been when compared to the full national dataset.
Comparison of DfE 2024 to the Alps Customer benchmark 2024
MEPs and MEGs
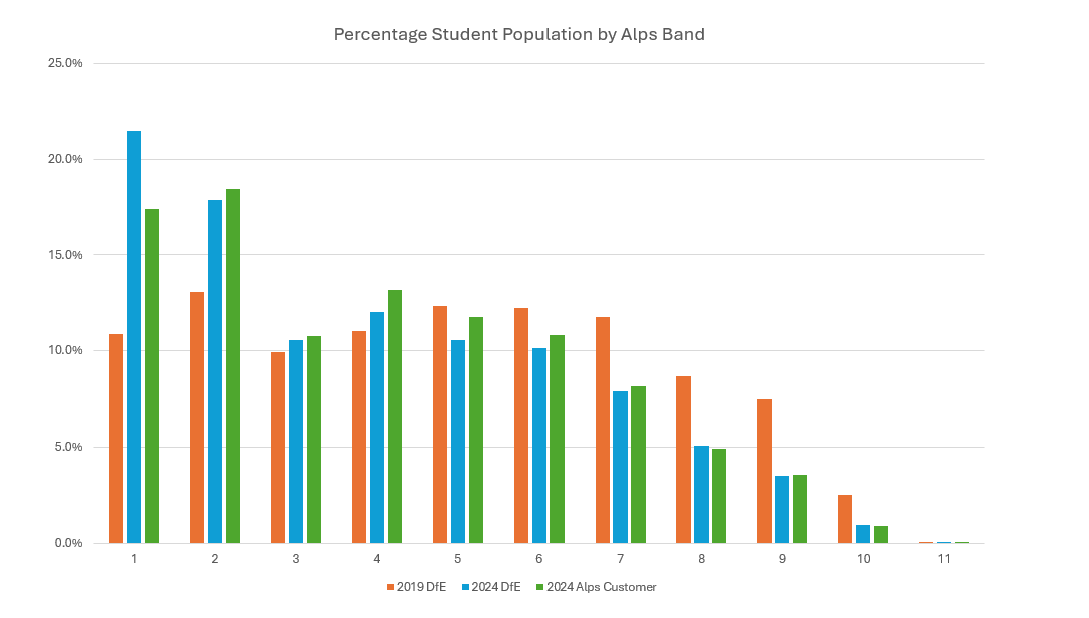
The diagram below shows the Alps prior attainment bands for A level from 1 to 11 and the proportion of students in each band. It compares the 2024 DfE national dataset with the Alps provider dataset from 2024.
Note that the 2024 Alps provider dataset contains approximately 50% of the entries contained in the national dataset, approximately 102,000 students and over 300,000 entries.
There remains a larger proportion of students in the top few bands, but with numbers beginning to fall back towards 2019 levels.
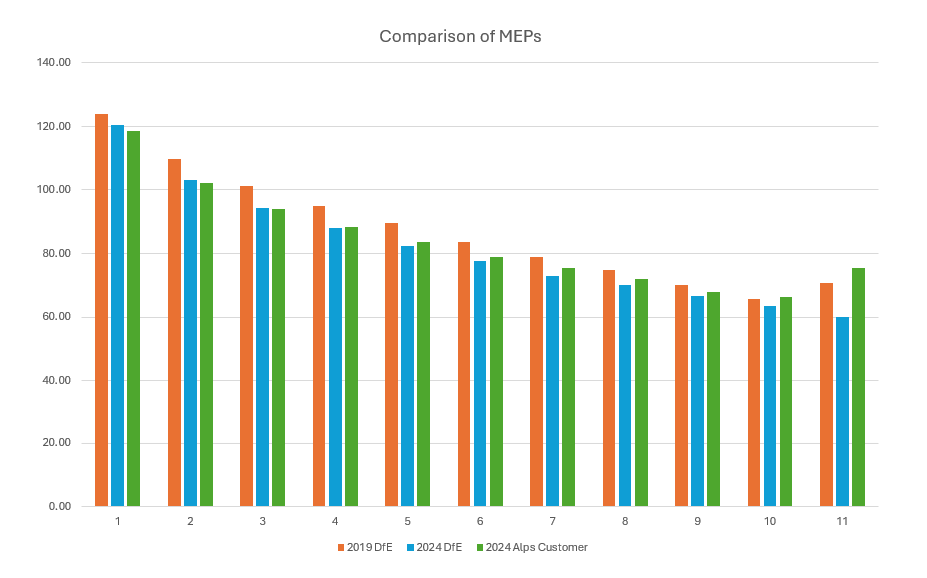
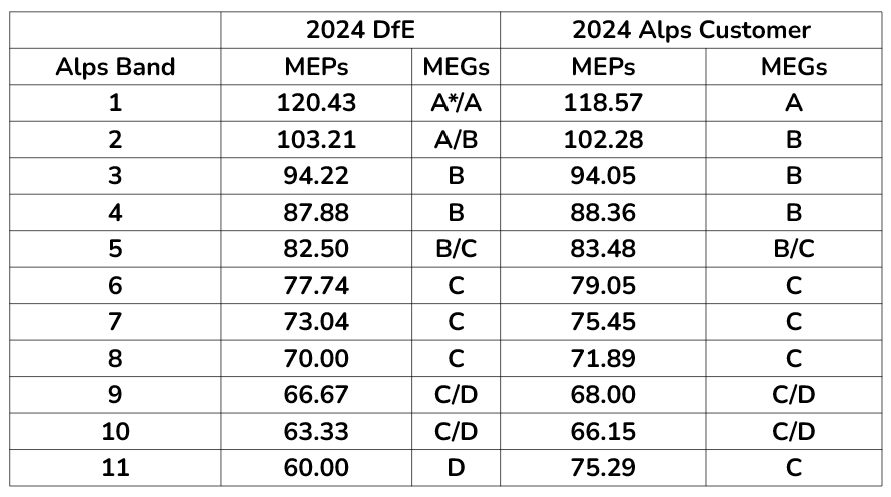
In terms of Minimum Expected Points, diagram below compares the target points required at the 75th percentile across Alps bands.
In most prior attainment bands, the MEPs generated from the 2024 Alps Customer benchmarks are very much in line with the DfE 2024 data. 2019 MEPs are generally higher pointing to a different value-added progress picture.
Translating those MEPs into grades, we arrive at the Minimum Expected Grades or MEGs. We can see in the table below that the MEGs needed in 2024 are similar when comparing the two datasets.
Implications on QI (Quality Indicator) grade
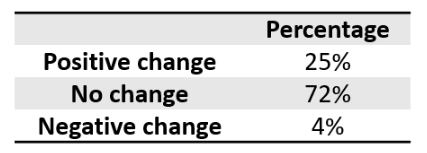
If we consider the impact of the difference in MEPs between 2024 Alps Customer benchmark and the DfE 2024 benchmark on the overall QI grade.
- There was no difference in the average QI score across Alps schools and colleges.
- 94% of schools and colleges saw QI shifts of 0.01 or less
- The impact on QI grades is as follows:
We believe that the 2024 Alps customer benchmark has therefore represented a realistic overview of the 2024 outcomes from a value-added perspective. We recommended you used this benchmark when assessing strengths and opportunities for development from the examinations.
What happens now with the 2024 DfE national benchmark?
On 1st May 2025 we will release the 2024 DfE national benchmark into Connect and Summit. The benchmark will be applied to historical gradepoints only, namely the gradepoints for KS5 A level from September 2023 up to and including the examination gradepoint for 2024.
The 2024 DfE national data will NOT be used for gradepoints from September 2024 onwards, in other words for monitoring your current Year 13 and 12 students. We believe that the 2019 national data provides more representative analysis for the 2025 examinations in terms of value-added.
Summer 2025 outcomes, value-added and the recommended benchmark
Your current Year 13 students are set to return to a profile more similar to 2019:
- Students in Year 13 for 2024.25 sat GCSE examinations in 2023 where standards returned to levels more similar to 2019.
- Examination outcomes for this cohort remain to be established, but are likely to be similar to levels somewhere between 2019 and 2024 depending on the ability of the cohort.
Therefore, the 2019 national dataset would be the most likely choice when monitoring this cohort across their KS5 courses.
We will continue to run an analysis of the Alps provider dataset in the days following the 2025 outcomes.
Summary of the benchmarks in Connect and Summit
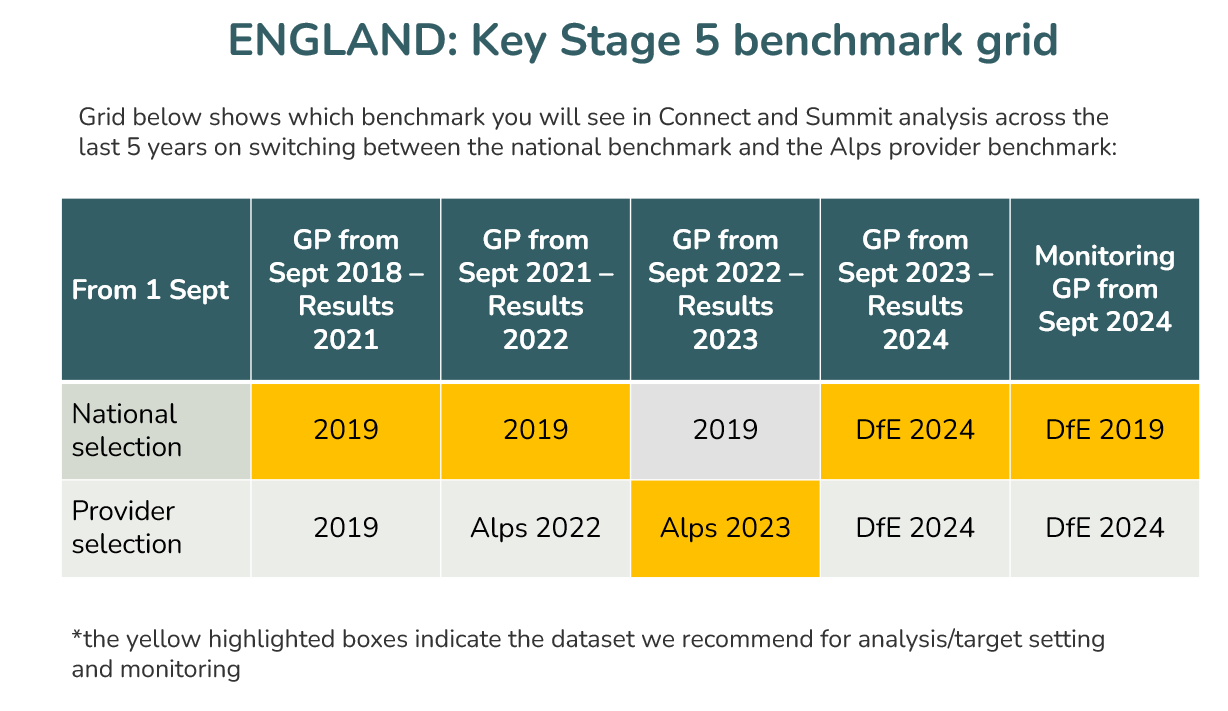
The tables below show which datasets are applied to which benchmark for which Academic Year.
- Default benchmark/national toggle. This is the DfE national benchmark. It has been the 2019 DfE dataset for some time in the absence of any further national data. For the 2024 outcomes only this will be replace on 1st May with the 2024 DfE data.
- When using the Alps customer benchmark:
- All gradepoints up to and including examinations 2020/21 are analysed against the national 2019 datatset.
- All gradepoints across 2021/22 will be analysed against the 2022 Alps customer benchmark.
- All gradepoints across 2022/23 and monitoring for 2023/24 will use the 2023 Alps customer benchmark.
- All gradepoints across 2023/24 and monitoring for 2024/25 will use the 2024 DfE benchmark.
This is complex, but the grid is necessary to support you in understanding the context in which you are viewing your analysis. The highlighted cells indicate our recommended benchmark for each cohort.
Related Articles
A level England - Analysis of 2025 DfE national dataset - February 2026
2025 A Level Results in England This article presents an overview of the findings from the Alps review of the DfE national dataset from 2025. It provides a comparison with the 2019 DfE national dataset, currently on toggle 1 of the benchmark selector ...A level England: analysis of Alps 2025 customer benchmarks - August 2025
2025 A Level Results in England This article presents an overview of the findings from the A level Alps customer benchmarks for England. It provides an outline of the national attainment picture before presenting a summary of the Alps provider ...Analysis and recommendations from 2025 DfE datasets - OVERVIEW ARTICLE
Overview article for all analysis from 2025 DfE datasets We are in the process of generating benchmarks from the national dataset published by the DfE following the 2025 examinations at KS5. Alps is only one of seven companies that are given access ...Analysis and recommendations from 2024 DfE datasets - OVERVIEW ARTICLE
Overview article for all analysis from 2024 DfE datasets We are in the process of generating benchmarks from the national dataset published by the DfE following the 2024 examinations at KS4 and KS5. Alps is only one of seven companies that are given ...Alps March 2025 Newsletter
Alps March Newsletter This edition will bring you up to speed with all the exciting news from Alps this March. Stay informed on upcoming releases and trending topics, explore our latest blog and videos from the Alps Education Team and read our latest ...